0 XP
Streak 0
0 / 10 complete

Day 3 Choose the Right Data

Same charts, new skill. Compare the data, do not just list it.

Annisa 10 short tasks 40 min

Today

Big: highest, lowest Change: rise, fall, overtake Group + compare

Your overview has no numbers. Your details include only the important numbers.

1 Look 2 Choose / Type 3 Check 4 Complete
Charts: Remastered in high resolution for clarity from low resolution teaching drafts. Data adapted for class from IELTS Liz Sample Charts and British Council Take IELTS Task 1. Simplified teaching data, same as Day 1 and 2. Free classroom use with credit.

Hello

1 min

Let us connect Days 1 and 2 to Day 3.

Overview or detail?

Look

Look at the tourists chart. It is the same chart as Day 2.
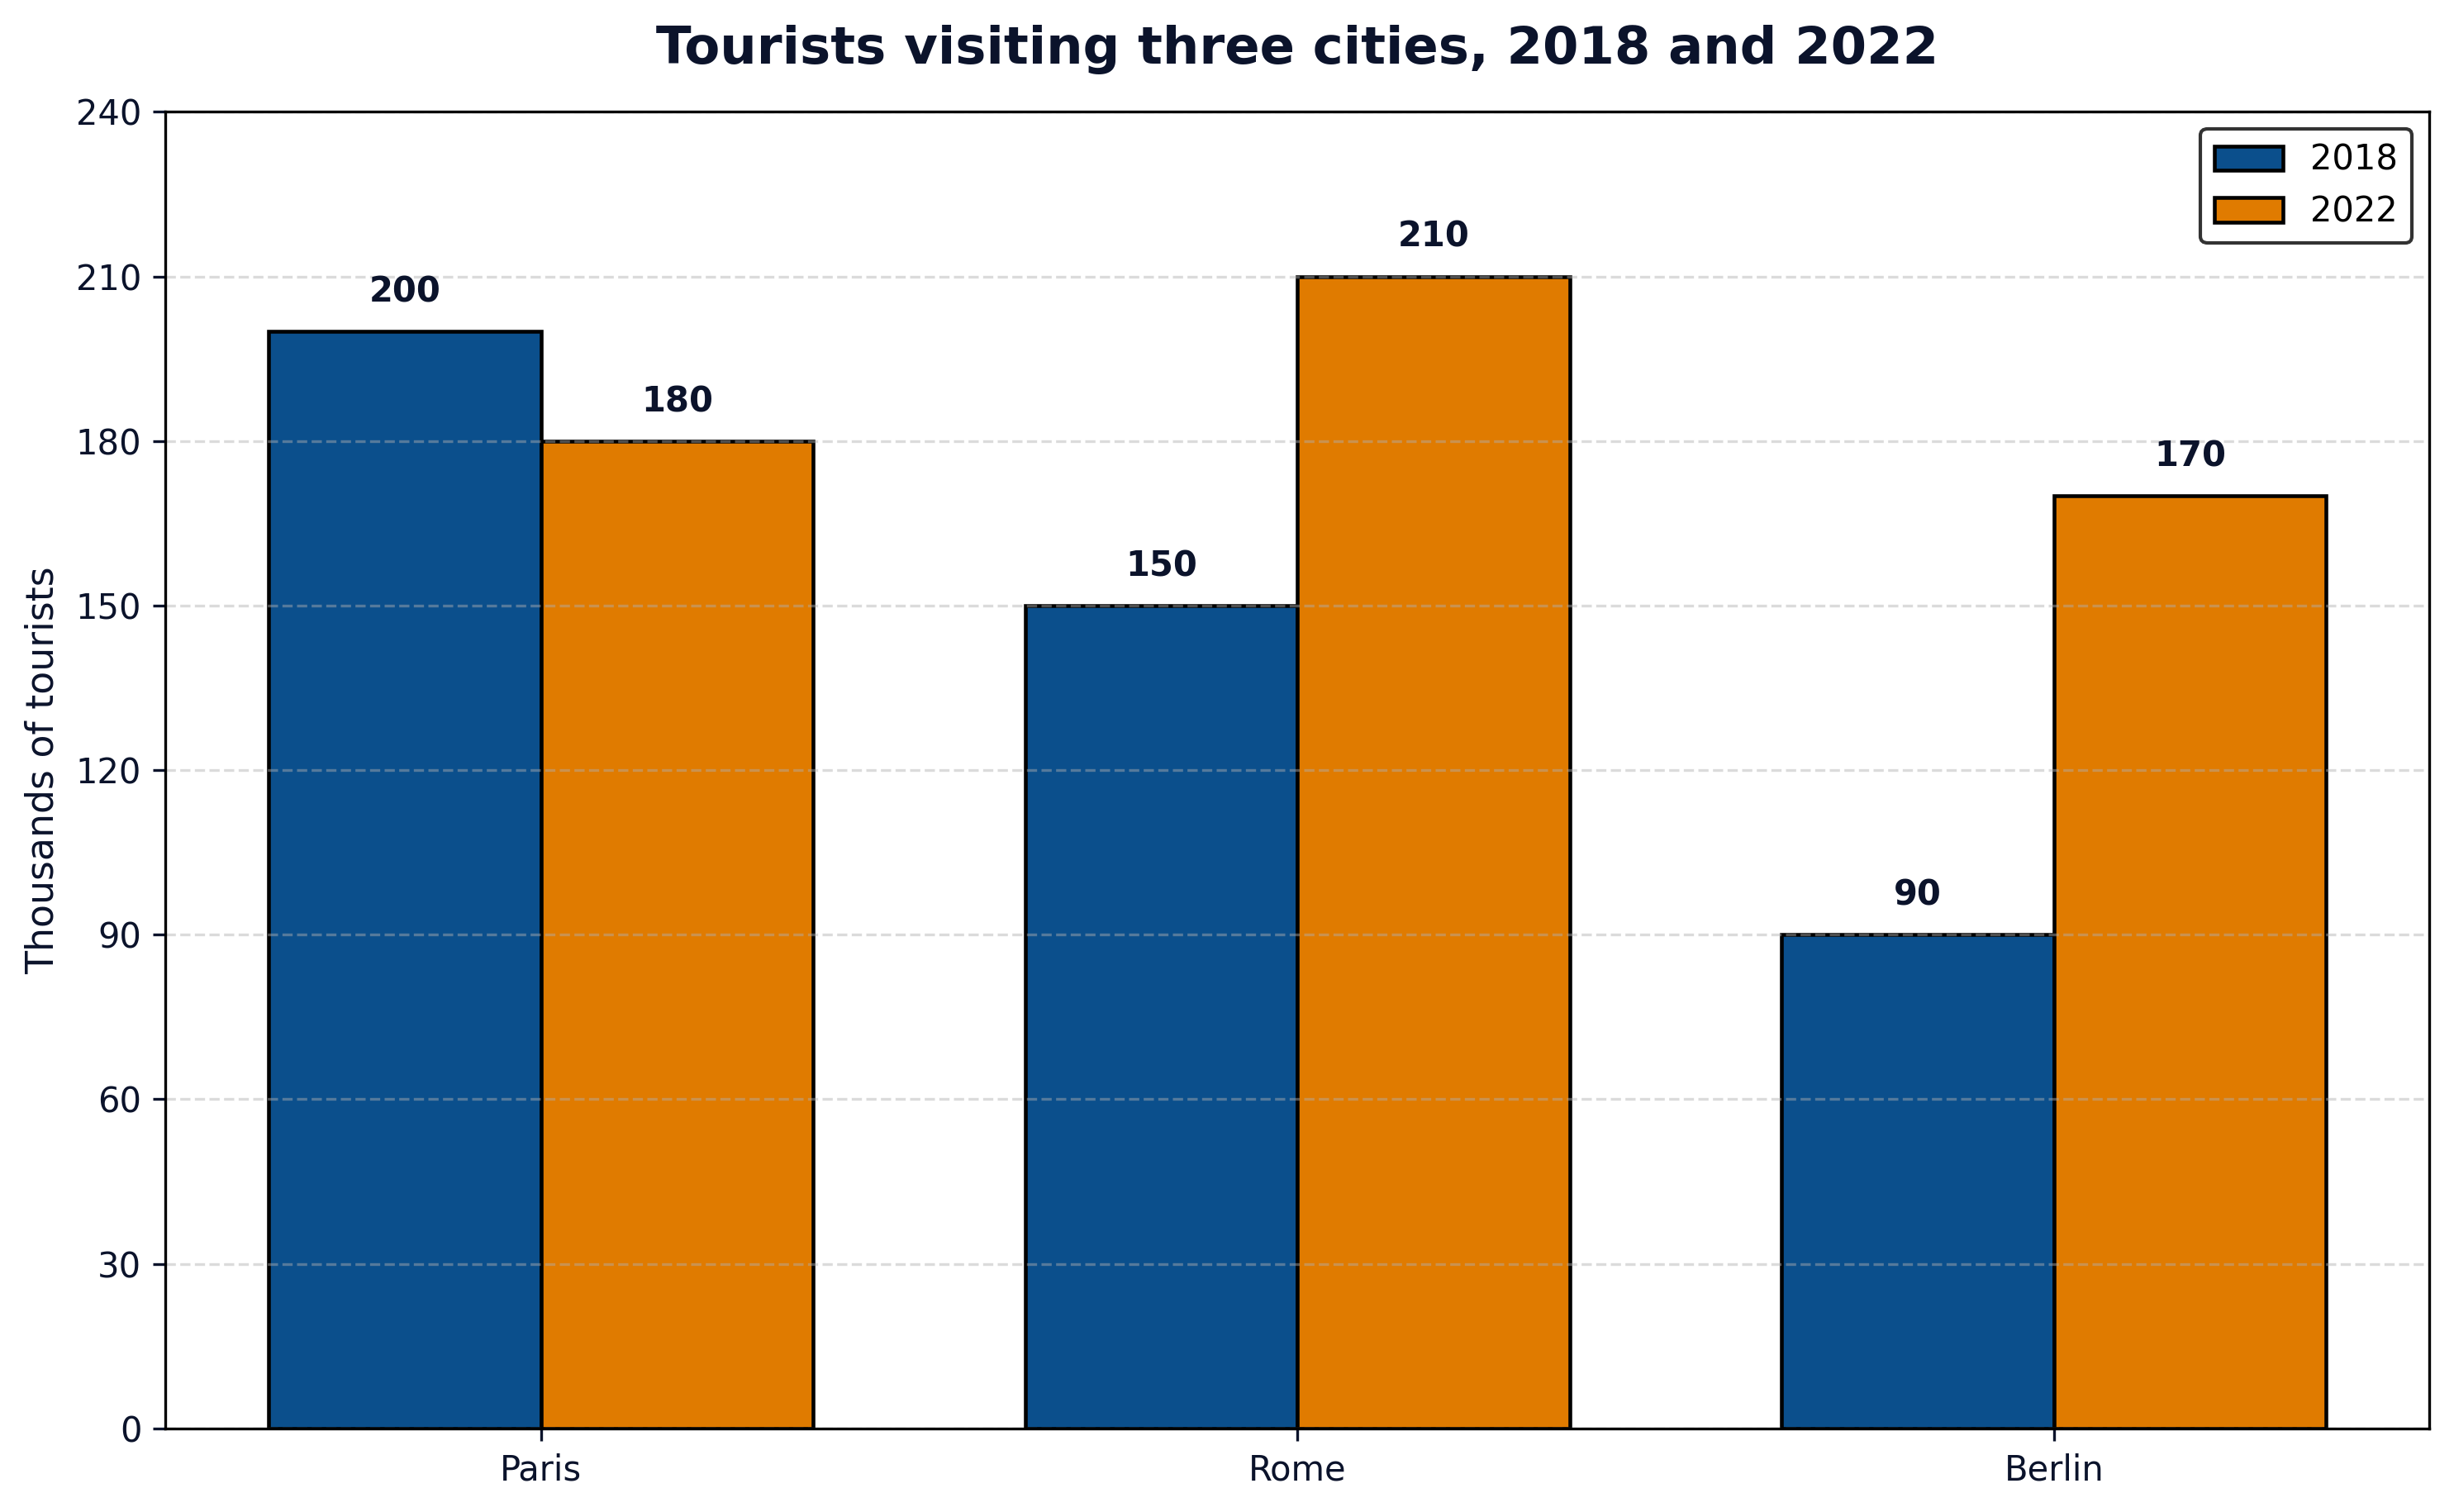
Bar chart: Tourists in thousands. 2018 Paris 200, Rome 150, Berlin 90. 2022 Paris 180, Rome 210, Berlin 170.
Tourists 2018 vs 2022. Remastered. Adapted from British Council practice via British Council Take IELTS. Free classroom use.
City20182022
Paris200180
Rome150210
Berlin90170

1. Overall, Rome overtook Paris, while Berlin grew from the lowest start.
2. In 2018 Paris stood at 200 thousand.

Which one is the overview?
Is ‘Overall, Paris had 200’ a good overview?
Job: The overview maps the ideas. The details walk through them.

Choose

3 rules

Do not use every number. Choose only the important ones.

What does ‘big’ mean?
What does ‘change’ mean?
What does ‘group’ mean?
Band 7: Select, highlight and compare.

Compare

Words

Write naturally. Do not just list the numbers.

Which word is comparative?
Which word is superlative?
In 2018 Paris was Rome,
by 2022 Rome was the most visited.

Say it

Numbers

Past + about

2018 is in the past, so use the past tense.

In 2018 Rome about 150 thousand,
then it 210 thousand by 2022.
Why do we use the past tense?
Prepositions: at 150, to 210, from 150 to 210.

Which details?

Core

Text A lists the numbers. Text B compares them.

Same tourists chart: Paris 200 to 180, Rome 150 to 210, Berlin 90 to 170.
Same tourists chart. Remastered. Source: British Council Take IELTS.

A In 2018 Paris was 200, Rome 150, Berlin 90. In 2022 Paris 180, Rome 210, Berlin 170.

B In 2018 Paris stood at 200, compared to 150 in Rome and 90 in Berlin. By 2022 Rome rose to 210 and overtook Paris, while Berlin almost doubled to 170.

Which text is better?
Why is it better?

We write 1

With teacher

Let us write about the 2018 start together.

Tourists chart, focus 2018: Paris 200, Rome 150, Berlin 90.
Tourists chart. Focus 2018. Remastered. Source: British Council Take IELTS.
2018ParisRomeBerlin
Thousands20015090
In 2018 Paris stood at 200, 150 in Rome and 90 in Berlin.
Berlin was at 90.

We write 2

Change

Now write about the 2022 change. Type one sentence yourself.

Tourists chart, focus 2022: Paris 180, Rome 210, Berlin 170. Rome highest.
Tourists chart. Focus 2022. Remastered. Source: British Council Take IELTS.
2022ParisRomeBerlin
Thousands180210170
By 2022 Rome 210 and overtook Paris,
Berlin almost doubled to 170.

You write

Full Task 1 12:00

Use the homework chart from Day 1. Write a full report.
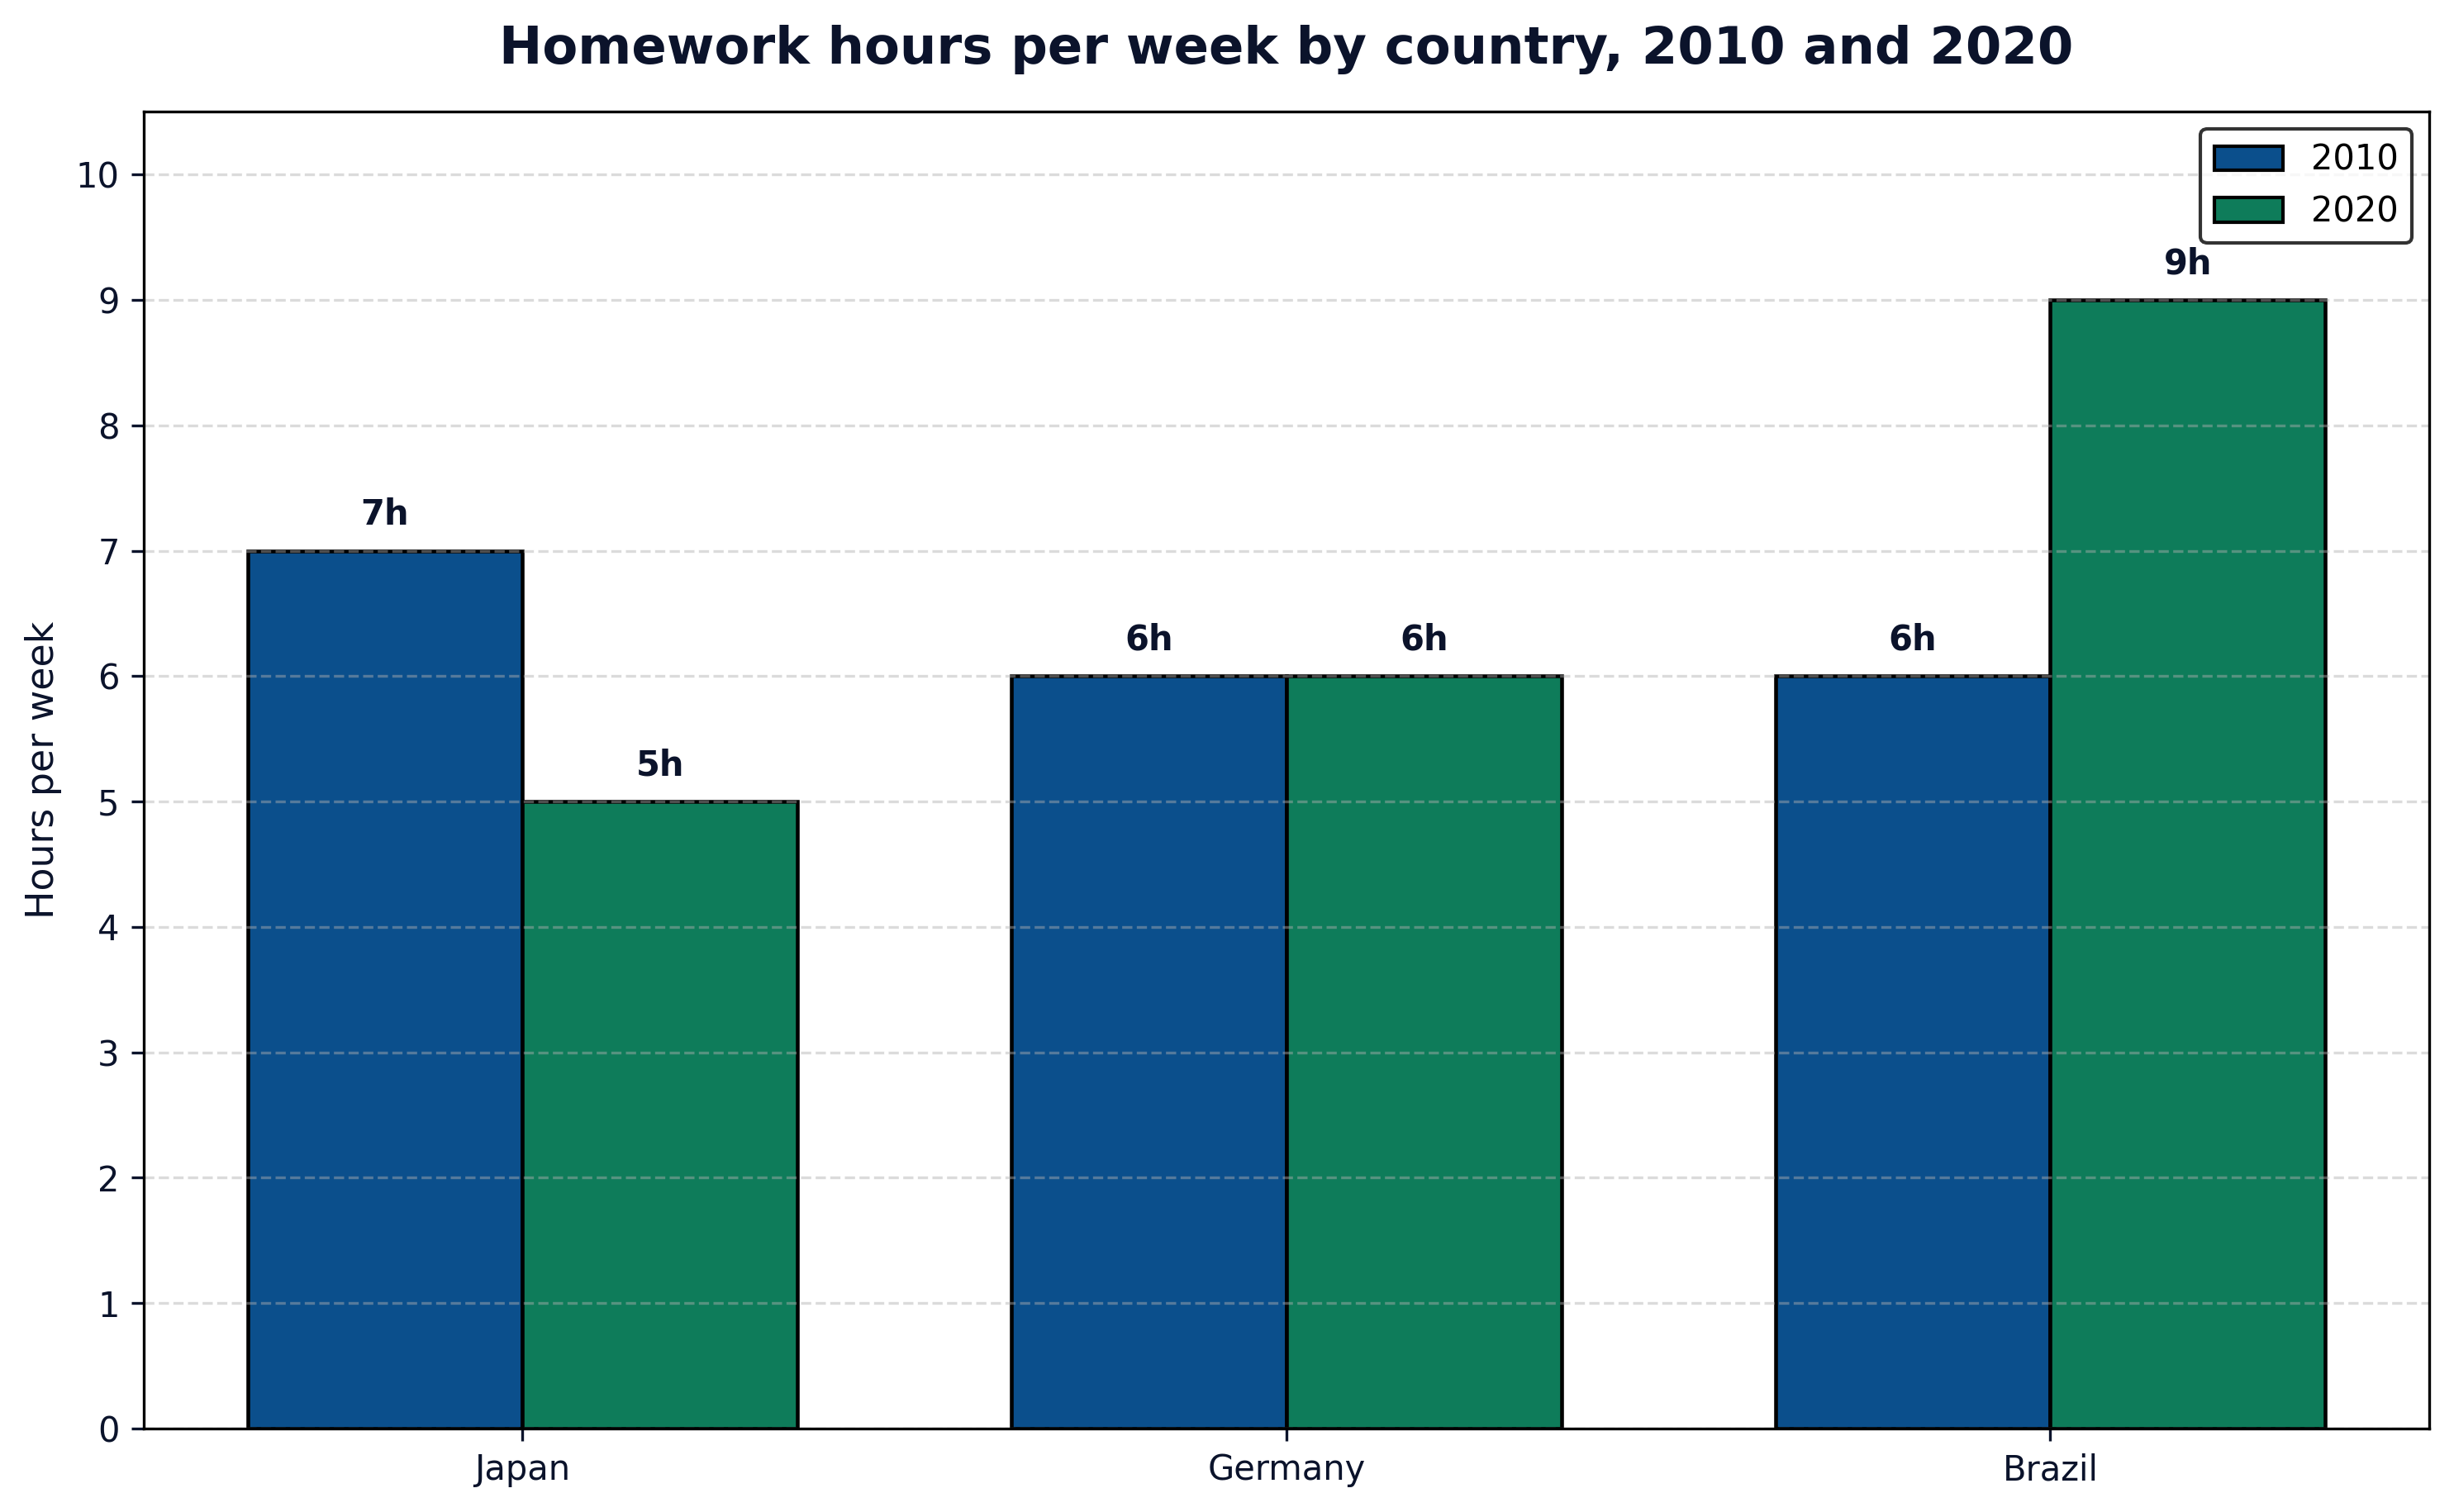
Bar chart: Homework hours per week. Japan 7 in 2010, 5 in 2020. Germany 6 and 6. Brazil 6 and 9.
High resolution remaster. Same data as Day 1. Style adapted from IELTS Liz Sample Charts. Free classroom use with credit.
Country20102020
Japan7 hours5 hours
Germany6 hours6 hours
Brazil6 hours9 hours

Write 4 parts: 1. Introduction, 2. Overview with no numbers, 3. 2010 details, 4. 2020 details. Write about 150 words. Use ‘while’ once.

Press Start, then write your report.

Check + list

1 fix

Choose one fix to focus on.

My sentenceBetterMy try
Rome has risen to 210.Rome rose to 210.Paris fell to 180.
What is your fix today?
1 hard3 ok5 clear
Homework: Fix 1 line, then write 5 lines using compared to, while, stood at, rose to and overtook.